
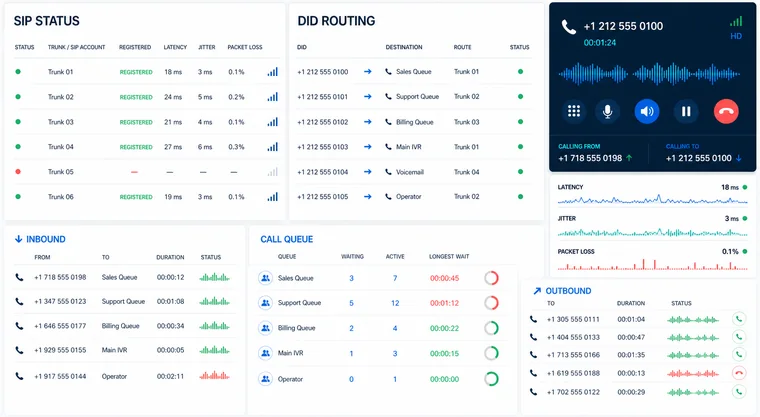
Decision framework
Use metrics as evidence, not as isolated promises.
Voice buyers often see ASR, ACD, PDD, NER and MOS presented as proof of route quality. These indicators are useful, but they answer different questions. Some describe call completion, some describe connected-call behavior, and others describe the media path after a call is established.
A meaningful review starts by agreeing on how each metric is calculated and then segmenting results by destination, network, traffic type and time window. The same provider can show very different results for business conversations, short contact center calls, invalid numbers and unanswered consumer traffic. The comparison is strongest when call detail records, SIP responses and media observations refer to the same test sample.
01 / Completion
Separate answered calls from network effectiveness.
ASR and NER both describe call outcomes, but they should not be treated as interchangeable. Define the denominator, the response codes included and whether customer behavior is separated from network failure before comparing providers or routes.
ASR: Answer-Seizure Ratio
ASR is answered calls divided by attempted calls, expressed as a percentage. It is affected by route completion, but also by unanswered calls, voicemail, invalid destinations, time zones and the behavior of the called audience.
NER: Network Effectiveness Ratio
NER is intended to separate network delivery from user-related outcomes. The exact response mapping matters, so teams should document which SIP or PSTN results count as effective delivery.
SIP response distribution
Counts of 2xx, 4xx, 5xx and 6xx responses provide context that one completion percentage cannot. Review response codes by destination and time rather than only as an account-wide total.
Practical check: Compare ASR only when the providers received a similar destination mix, call purpose, time window and quantity of valid numbers.
02 / Call behavior
Read ACD and PDD with the traffic sample.
Duration and setup timing can reveal a change in route behavior, but neither has one universal target. A useful baseline is destination-specific and is compared with the same traffic type over time.
ACD: Average Call Duration
ACD is total connected duration divided by answered calls. A sudden change may justify investigation, but campaign scripts, voicemail, customer intent and short legitimate calls can also move the average.
PDD: Post-Dial Delay
PDD measures call setup time from the agreed start event to the first meaningful progress, ringing or answer event. Measurement conventions must match before results are compared.
CPS and busy-hour behavior
Calls per second and concurrency can expose signaling or capacity limits that are invisible in a low-volume test. Review setup timing during the intended busy period as well as during a quiet sample.
Practical check: Record the precise PDD start and end events in the test plan so two systems do not report different values for the same call.
03 / Media path
Add packet and listening-quality evidence after connection.
A successfully answered call can still have poor audio. Media quality should be reviewed in both directions and correlated with the path, codec, endpoint and network conditions used during the test.
MOS and R-factor
MOS summarizes perceived or estimated listening quality on a familiar scale. State whether the score is predicted by an algorithm or produced by a listening test, and keep the method consistent.
Packet loss and jitter
Packet loss removes audio data, while jitter describes variation in packet arrival time. Bursts, direction and jitter-buffer behavior can matter more than a single account-wide average.
Latency and media direction
Delay can affect conversation flow even when audio is intelligible. Check both directions, one-way audio, RTP reachability, codec negotiation and whether media takes the expected path.
Practical check: Keep signaling and RTP timestamps for the same call IDs so setup issues and media issues are not investigated as unrelated events.
04 / Decision record
Turn the metrics into a repeatable acceptance test.
The objective is not to collect the largest possible dashboard. It is to define a test that represents the production workload, produces evidence both teams can inspect and identifies what happens when results move outside the agreed range.
Create the baseline
Document destinations, fixed or mobile networks, valid-number rate, time window, calling platform, codec, caller identity, CPS, concurrency and sample size.
Define the comparison
Choose the metrics, formula, segmentation and observation window before traffic is sent. Keep raw counts alongside percentages so a small sample is visible.
Connect results to action
Agree on ticket evidence, severity, investigation ownership, route-change authority and a retest method before production volume is introduced.
Practical check: Preserve the version of the test brief, route or rate context and CDR export used for each acceptance decision.
Ready-to-send brief
VoIP quality test checklist
Use these inputs to create a comparable route or SIP trunk test with enough context for technical review.
- Destination countries, networks and priority prefixes
- Traffic purpose, valid-number assumptions and caller ID model
- Expected call attempts, busy-hour CPS and concurrency
- Average duration and known answer behavior
- Originating platform, signaling IPs, media IPs and codecs
- Definitions for ASR, NER, ACD and PDD
- SIP response codes and disconnect-cause mapping
- Packet loss, jitter, latency and MOS measurement method
- Call IDs, timestamps and CDR fields retained for investigation
- Acceptance range, ticket evidence and escalation ownership
Common questions
VoIP quality metric questions
What is a good ASR for VoIP termination?
There is no universal ASR target. Destination mix, valid-number rate, time of day, called-party behavior and traffic purpose all affect the result. Compare ASR for equivalent traffic samples and review the associated response codes.
Does a high ACD prove that a route has good quality?
No. ACD can support a quality review, but call purpose and customer behavior strongly influence duration. Use ACD with completion, signaling and media evidence rather than as a standalone score.
What is the difference between ASR and NER?
ASR counts answered calls against attempts. NER is intended to show whether the network delivered calls to a meaningful user outcome, including some user-related failures. The exact cause-code mapping should be documented.
Which metrics help diagnose poor VoIP audio?
Packet loss, jitter, latency, MOS or R-factor, codec negotiation, RTP direction and endpoint behavior are useful. Correlate them with the same call IDs and timestamps used in signaling and CDR records.
How large should a VoIP route test be?
The sample should represent priority destinations, fixed and mobile networks, normal and busy periods, realistic CPS and enough calls to avoid drawing conclusions from a handful of attempts. The required size depends on the traffic profile.
